





After a disappointing ski season across much of the Northwest last winter, there’s reason to be optimistic about 2026–27. Historical snowfall data from previous strong El Niño seasons and the latest seasonal precipitation forecasts point toward a great winter for Oregon’s Cascades. So, let’s start with the bottom line and my forecast for Oregon skiers.
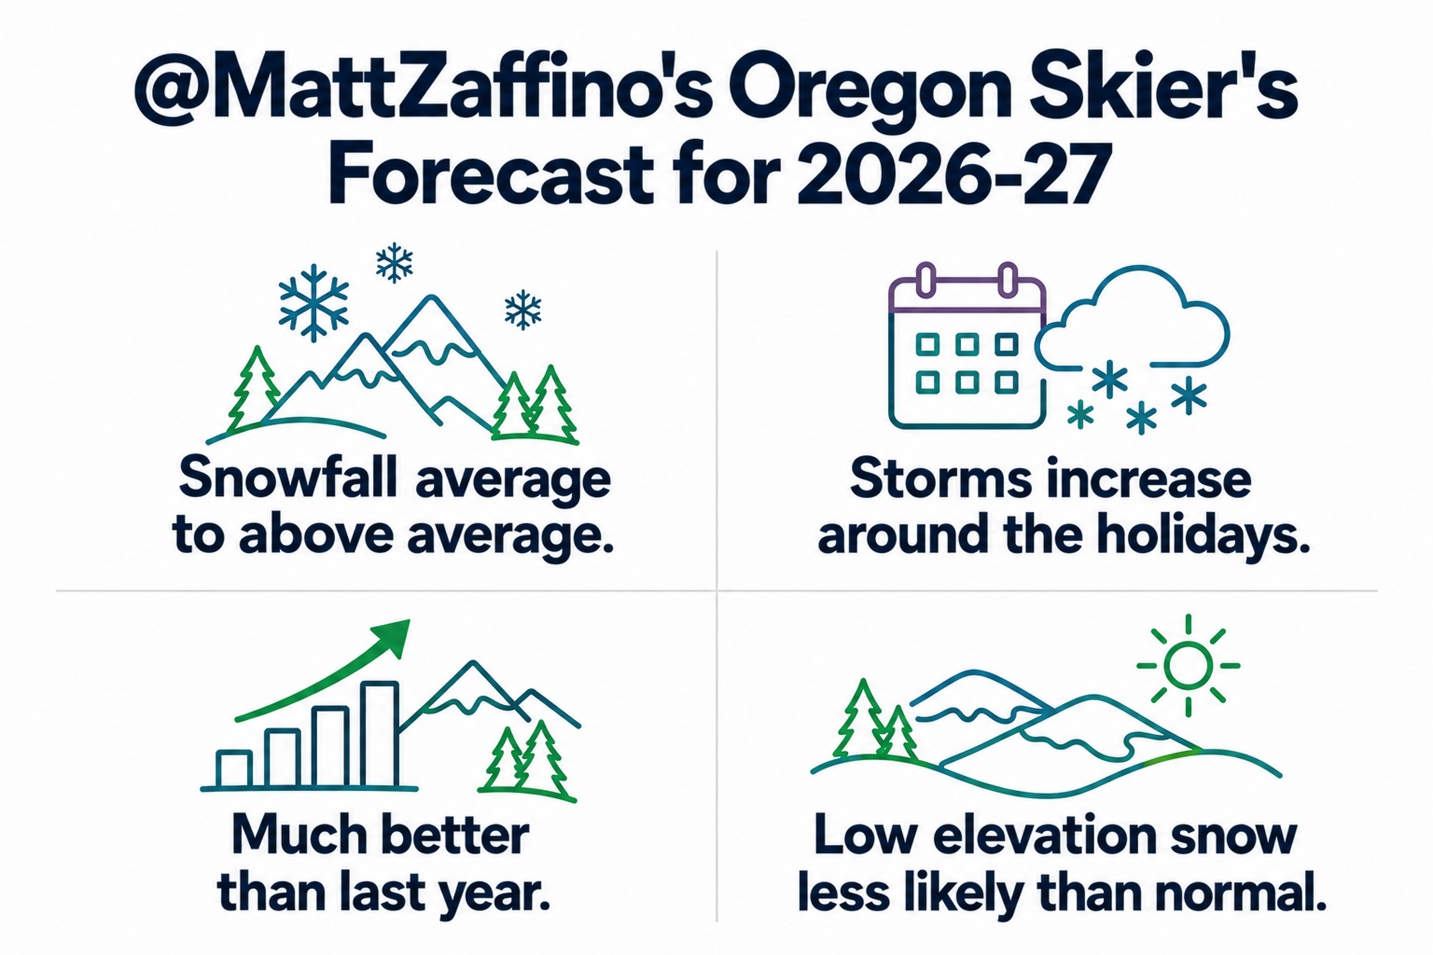
The outlook calls for average to above-average snowfall, an increase in storms around the holidays, and a season that looks much better than last year. However, low-elevation snow may be less likely than normal.
El Niño could be strongest on record
As you may have heard, the 2026-27 season will see an exceptionally strong El Niño developing, and it could become the strongest on record. Sea surface temperatures in the eastern Pacific are running nearly 6°F above average, while measurements beneath the surface—down to about 300 feet—show some areas as much as 18°F above average. That’s a lot of extra heat stored in the ocean, with climate change playing a role. We’ll come back to that.
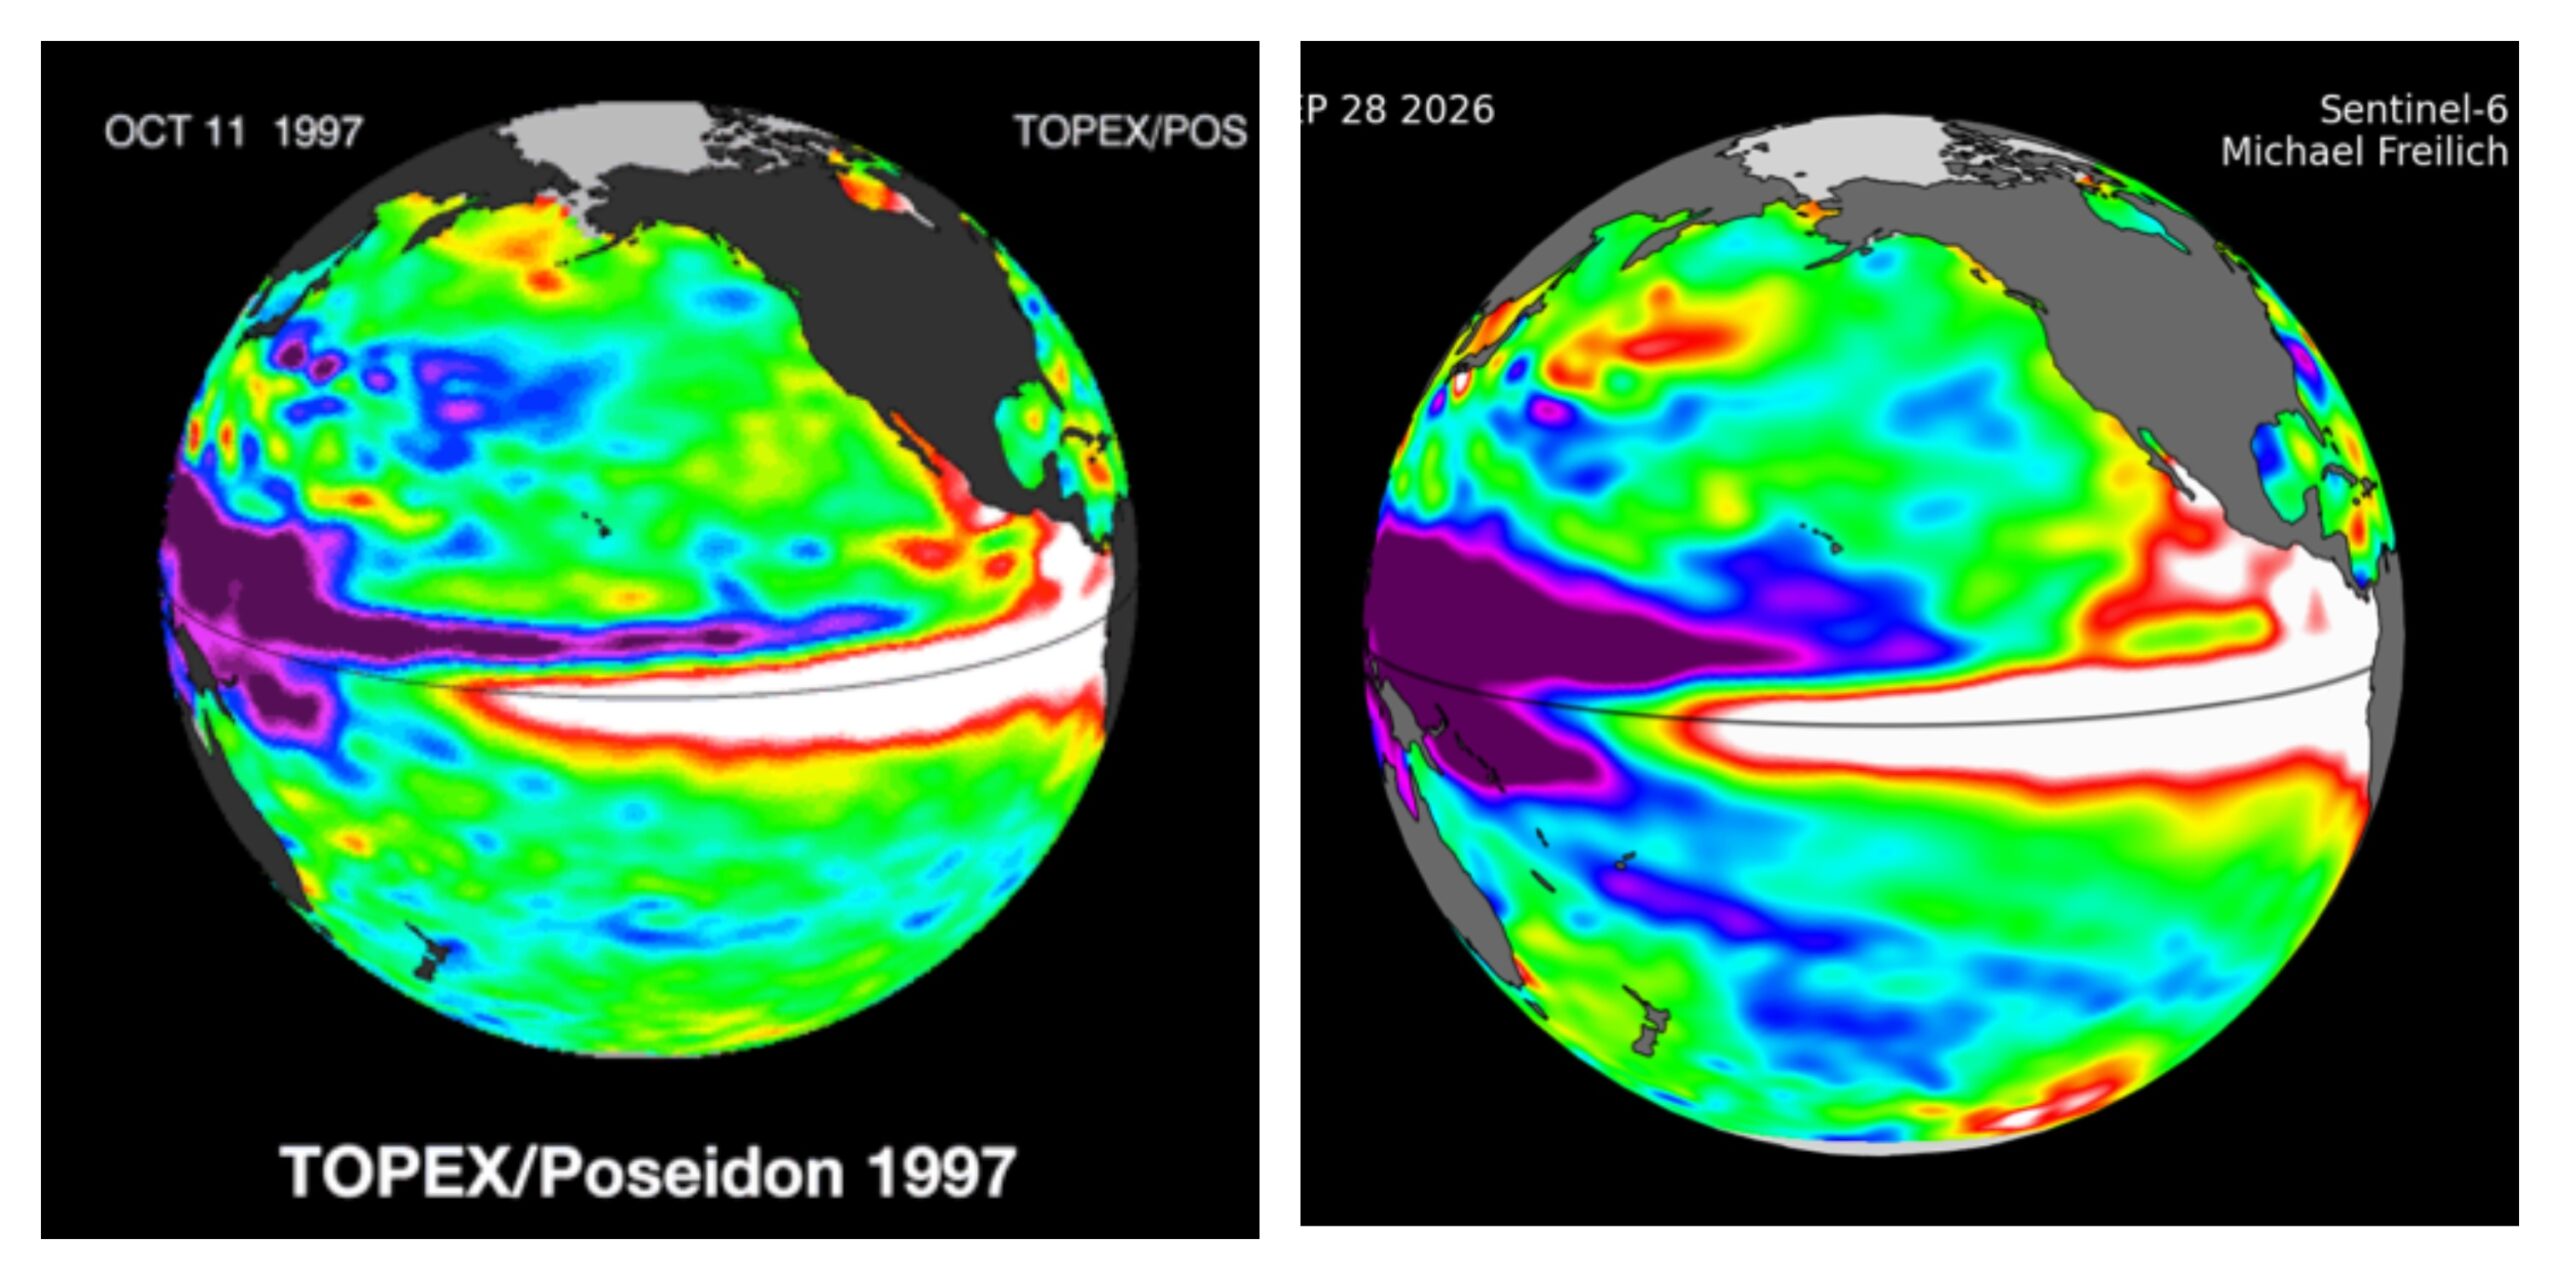
The graphic below shows sea surface height anomalies over the Pacific. Yes, sea levels actually rise and fall. Areas shown in white indicate higher-than-average sea levels, which correspond to really warm water.
So, what in the name of Ullr, the Norse god of snow, does any of this have to do with whether you should buy a season pass? Getting to that, stay with me. On the left is an image from October 1997 and on the right is October 2026.
What happens in a strong Super El Niño year?
See the similarities? The strong El Niño of 1997–98 is one of our best analog years for what’s developing in the Pacific now, along with 1982–83 and 2015–16. By looking at what happened during those winters, we can get a sense of what might lie ahead. And when it comes to Oregon, the historical outlook is encouraging — certainly more so than for, say, the northern Rockies.
So, we’re going to look at snowfall during those analog years, along with seasonal precipitation forecasts from the European Centre for Medium-Range Weather Forecasts (ECMWF). These forecasts use physics-based models run multiple times with slightly different starting conditions, then combine the results.
But first, let’s take the 30,000-foot view of El Niño. Which is especially appropriate since we’re talking about jet streams! Ha. Weatherman humor. I know, it has its highs and lows.
The graphic below shows the classic El Niño pattern: a split jet stream, with the subtropical jet aimed at Southern California and extending east across the country. The polar jet is much farther north than its usual winter position.
But keep in mind, not all El Niño (or any) winters are created equal. And really strong Super El Niños are in a class of their own. That’s because there is so much extra warmth and moisture supplied by the tropics, that the subtropical and polar jet can sometimes merge and wash the entire West Coast with storms.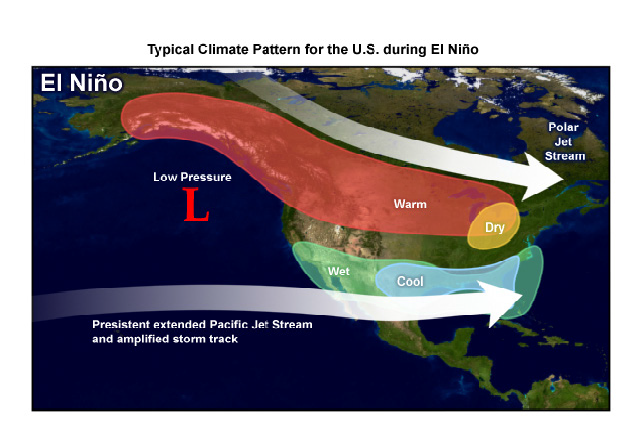
So, let’s look at snowfall across the Northwest during the 1997–98 winter, which I think is the best match for this year. We’ll also look at 1982–83 and 2015–16, two other exceptionally strong El Niño seasons.
What’s the forecast for Mt. Hood?
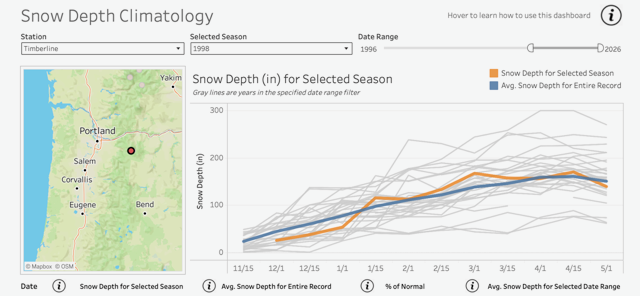
The next three graphs show snow depth at Mt. Hood Meadows and Timberline in Oregon, and Crystal Mountain and Mt. Baker Ski Area in Washington. The data comes from the Northwest Avalanche Center (NWAC). You can explore the data yourself and compare different years using the Washington State Climate Office Snow Depth Tool.
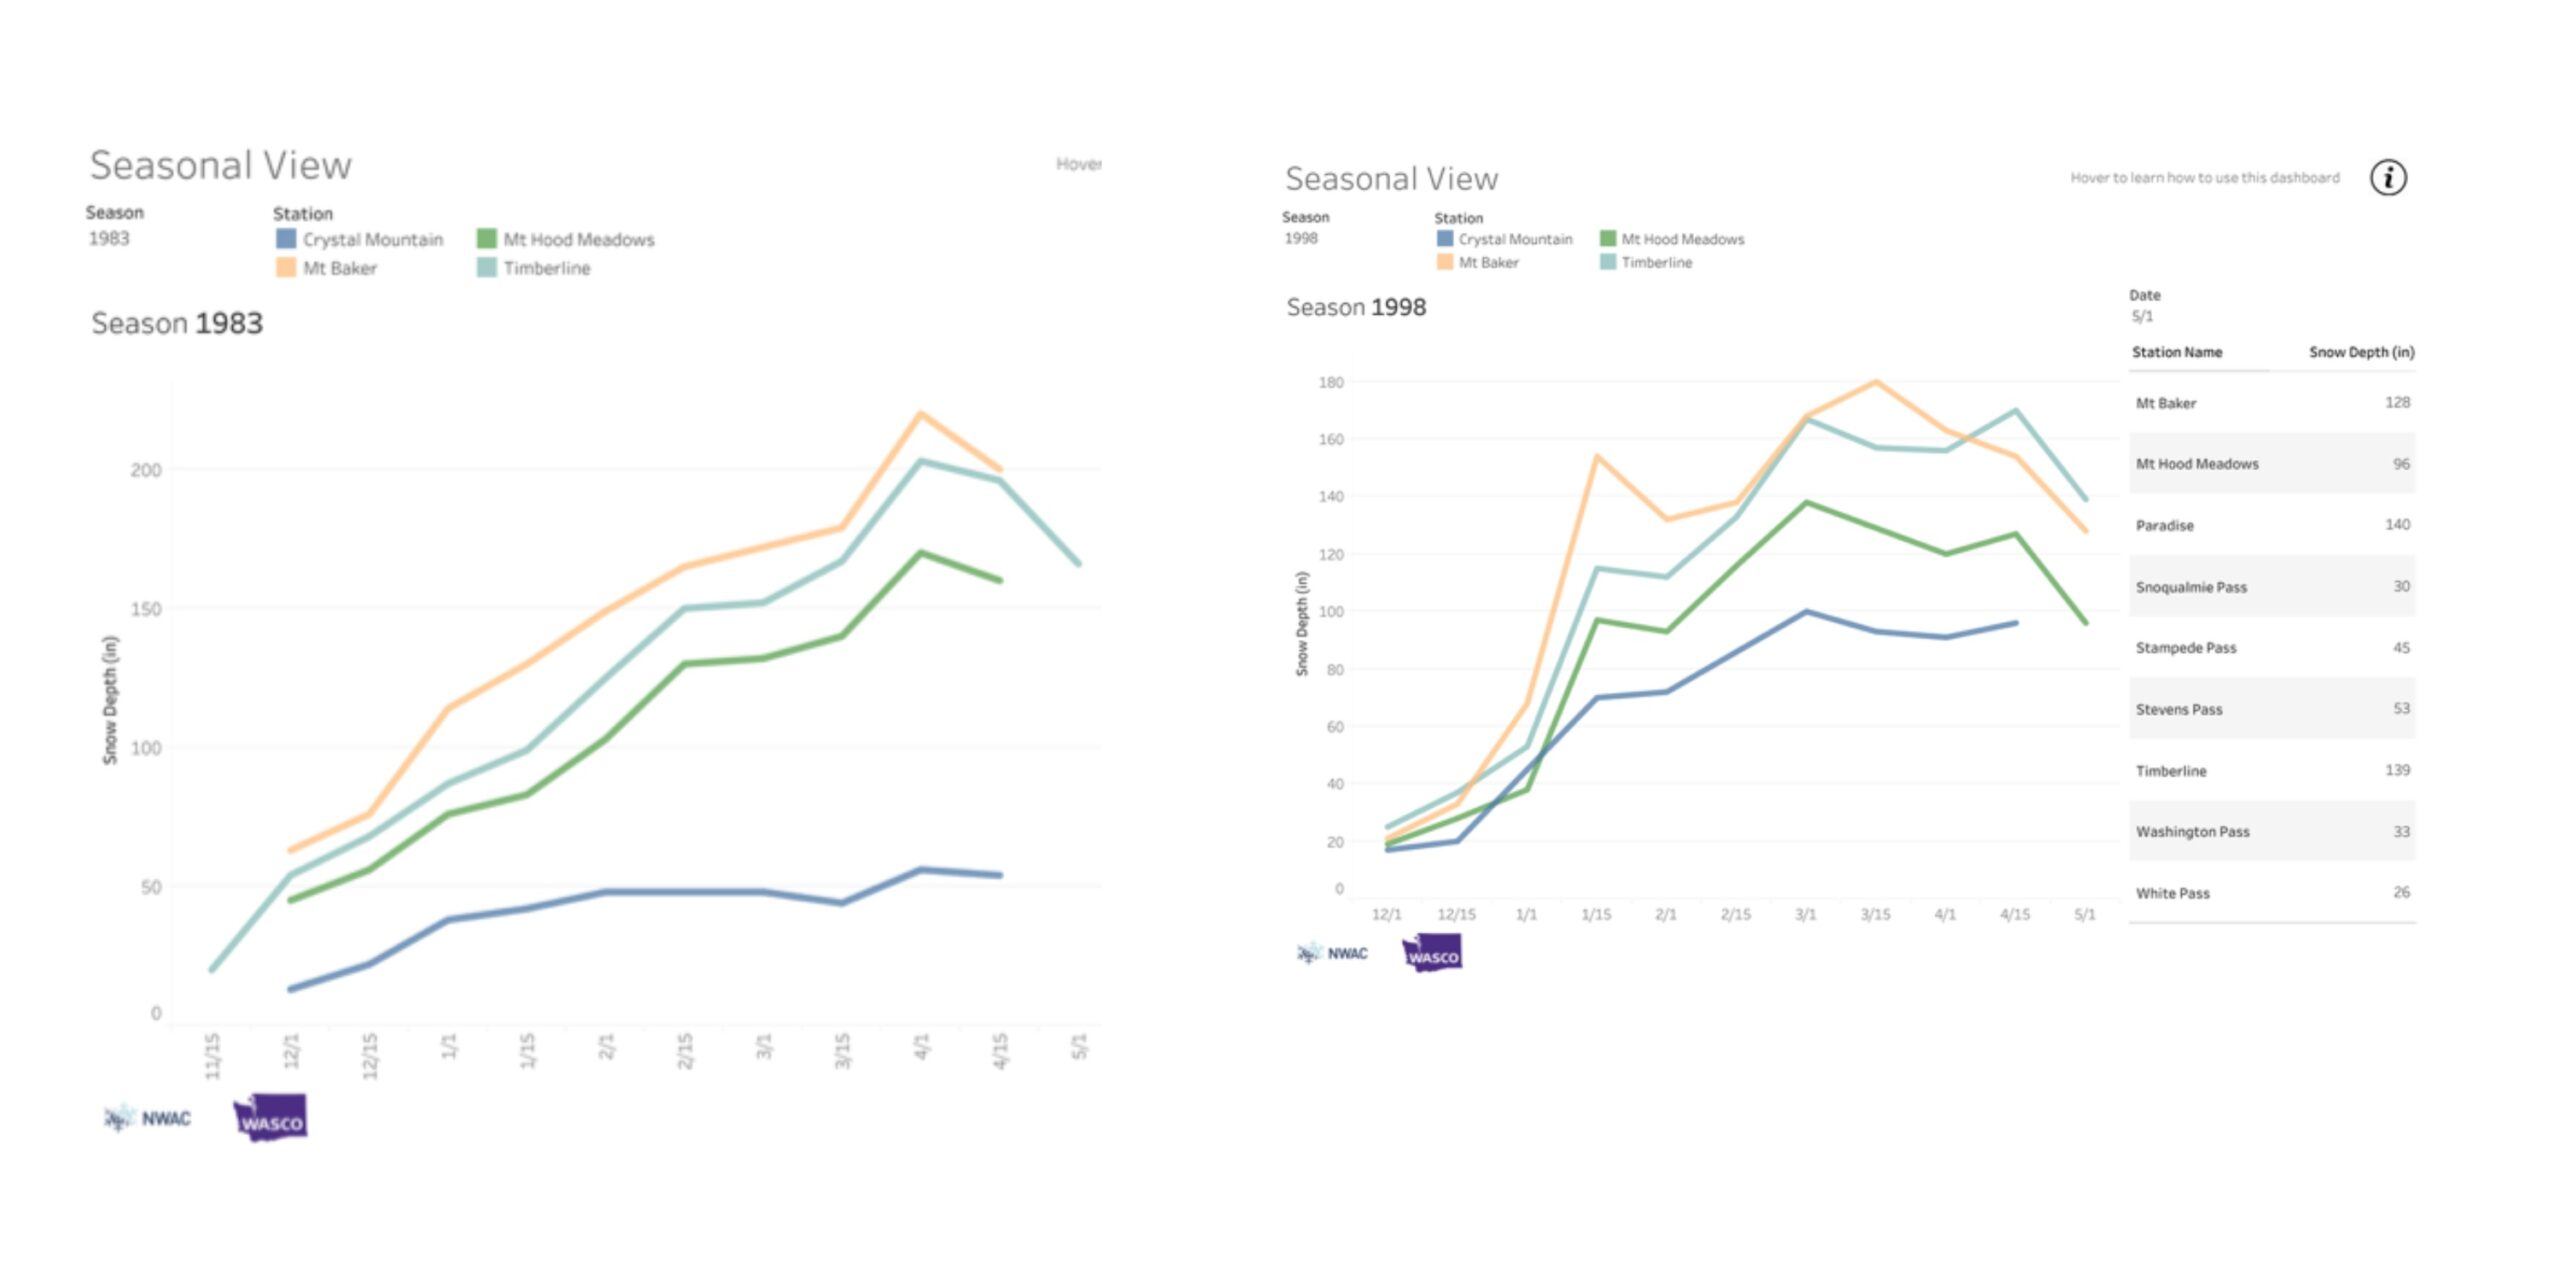
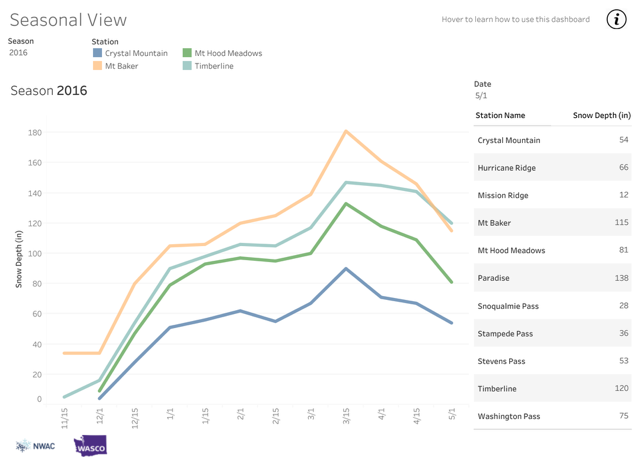
What’s interesting is that all three years follow the same pattern. Even more encouraging, Mt. Hood ski areas saw average to above-average snow depths during these Super El Niño seasons. The graph below shows Timberline’s snow depth during the 1997–98 season, which I think is the best analog for the winter ahead.
What’s the forecast for Central and Southern Oregon?
I don’t have graphs for Mt. Bachelor, but the good folks there provided the snowfall data. Mt. Bachelor’s average seasonal snowfall is 403 inches.
1982-83 Season: 536” of snowfall, at 133% of average
1997-98 Season: 333” of snowfall at 82% of average
2015-16 Season: 411” of snowfall at 101% of average
Two of the three Super El Niño seasons delivered average or above-average snowfall at Mt. Bachelor. Across all three, the average was about 427 inches—two feet above average.
Farther south to include our friends at Willamette Pass, Mt. Ashland and Warner Canyon, the data from Crater Lake paints an even snowier picture. All three Super El Niño seasons brought above-average accumulated snowfall.
It’s worth noting the difference between accumulated snowfall and snow depth. Snow depth measures how much snow is on the ground, accounting for settling, compaction and melting. Accumulated snowfall adds up every snowfall throughout the season, regardless of what happens to earlier snow after it lands. That’s why accumulated snowfall totals are much higher.
But the takeaway is the same: during these three strong El Niño seasons, Central and Southern Oregon generally saw average to above-average snowfall. So, our analog years show decent snowfall across the Cascades, especially in the southern Oregon Cascades. But what do the physical models say?
One of the best tools we have for seasonal forecasting is the European Centre for Medium-Range Weather Forecasts (ECMWF). In the maps below, the one on the left shows the probability of above-average precipitation for December through February; the one on the right covers January through March. Dark green indicates the highest probability of above average precipitation.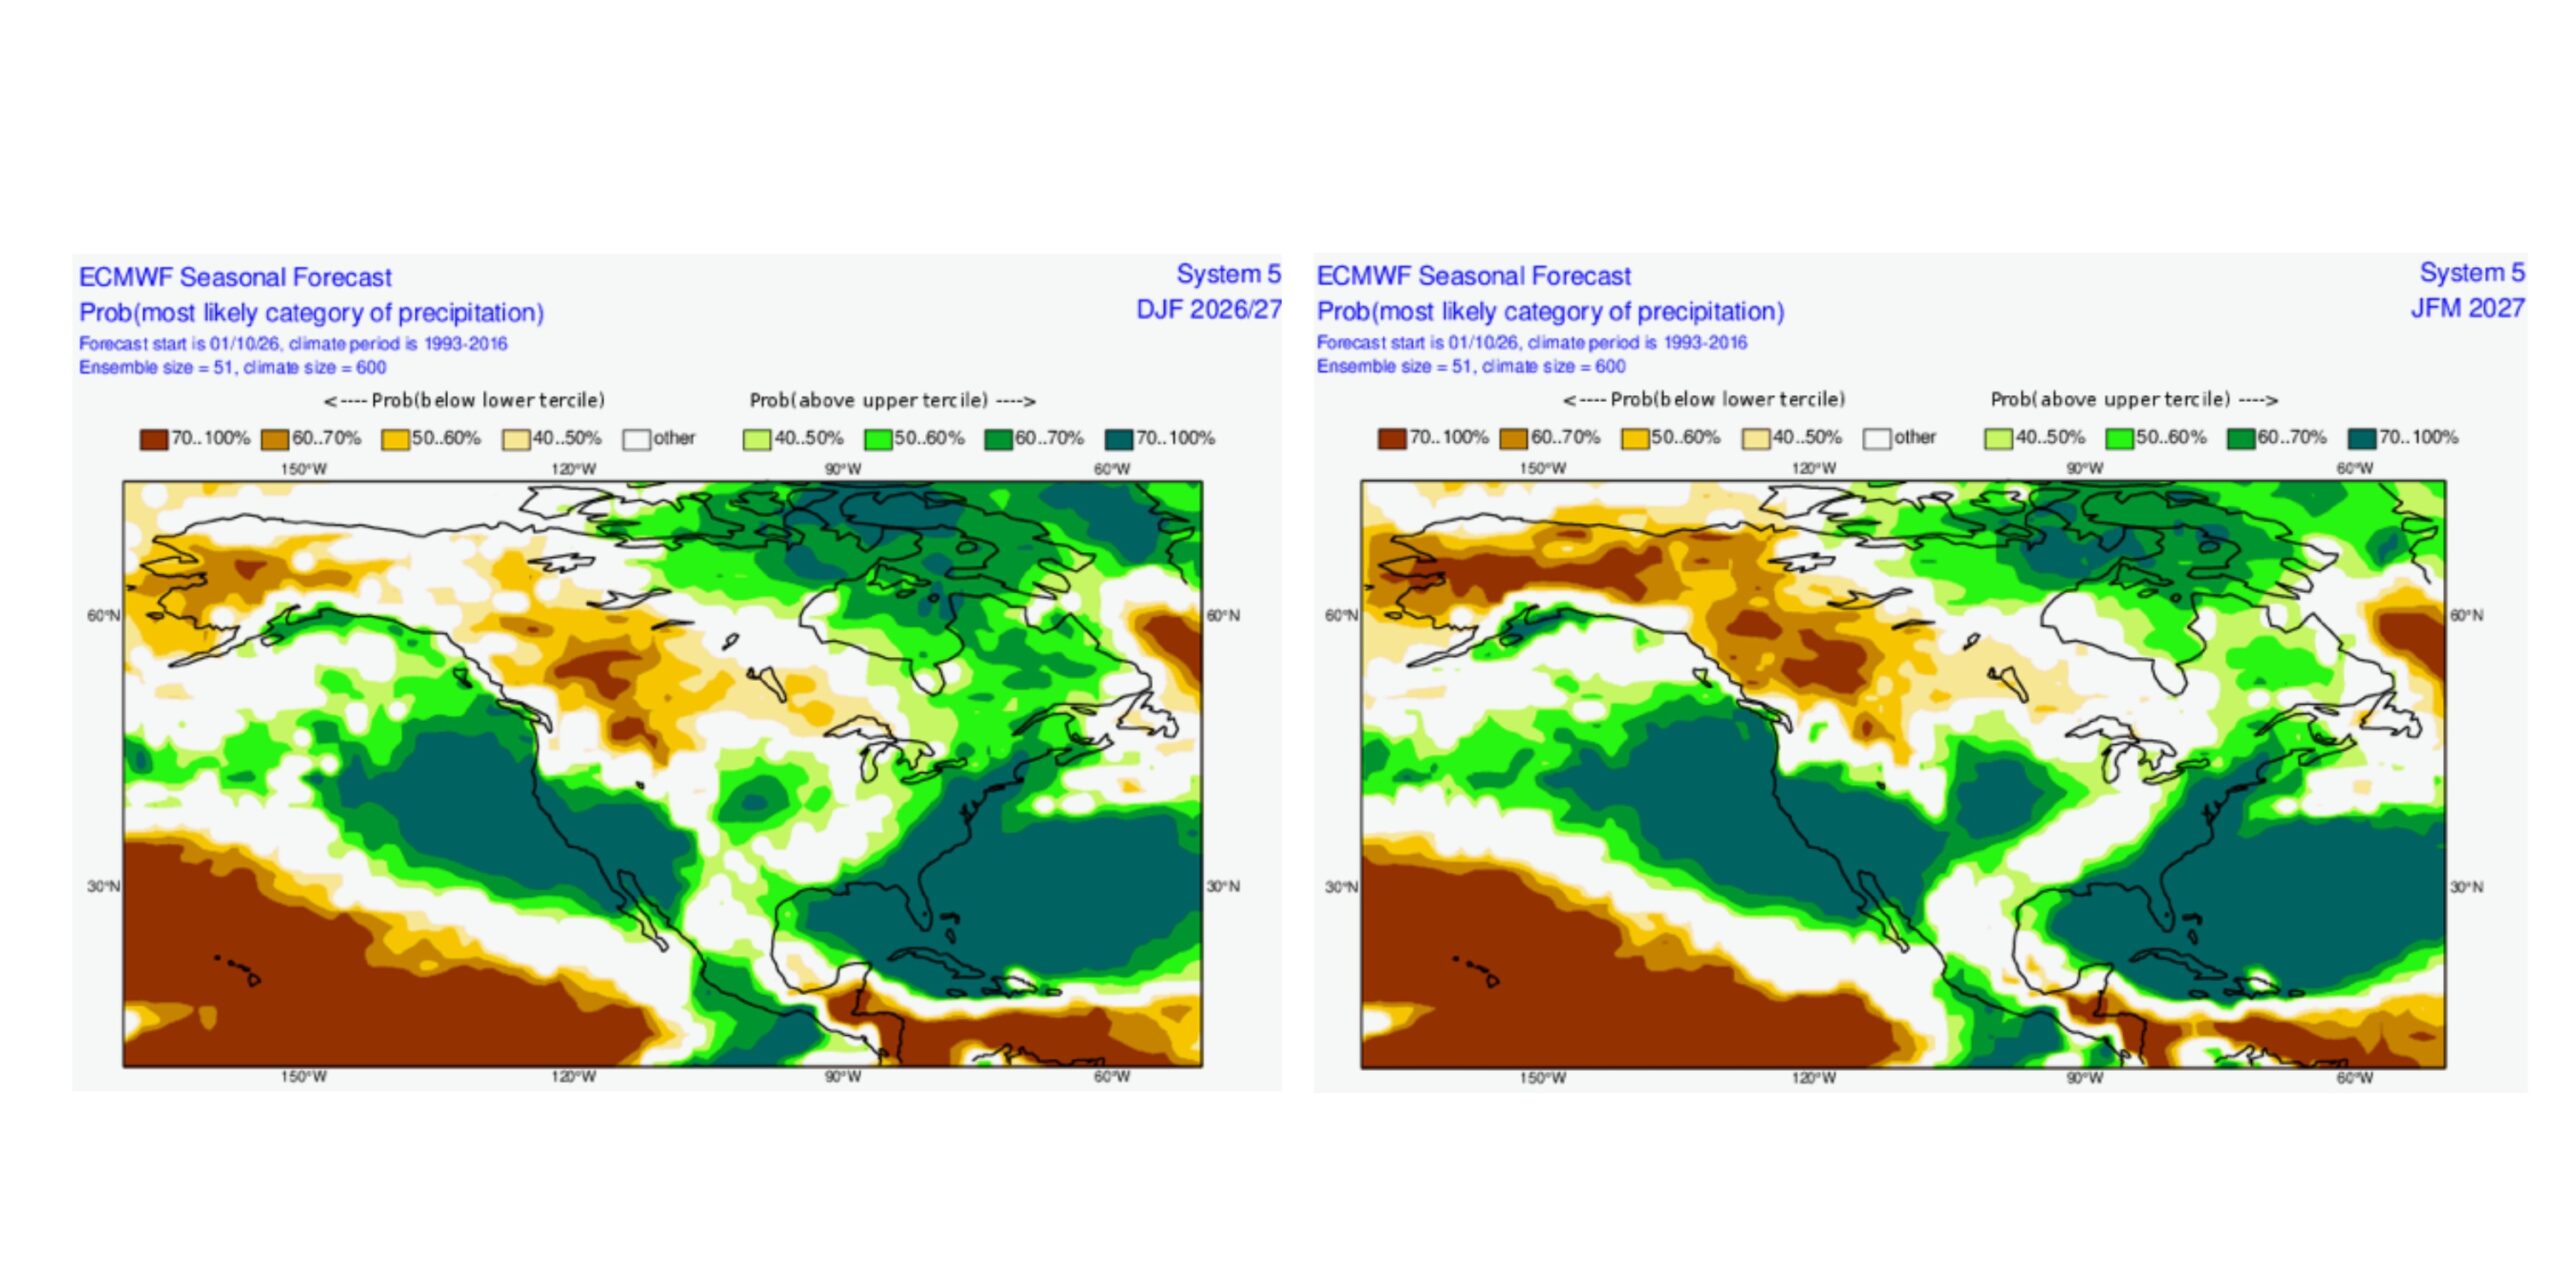
Final notes: A better season ahead
The forecast reads like a classic El Niño story, except, Oregon is favored for average to above-average precipitation. That lines up with what we found in the historical analogs. We like it when different forecast methods are consistent with each other, it lends confidence.
Last year was not good, to put it lightly. The good news is that both forecasting methods point toward a better season ahead.
Will there be periods of warm weather between storm cycles? Of course. There usually are, no matter what phase of El Niño we are in. Arctic outbreaks of really cold air may be less likely, but they’re certainly not off the table. Portland, after all, got nine inches of snow in January 1998.
El Niño generally sets the table for milder conditions across the Pacific Northwest, so the odds of a really cold winter are lower. But that doesn’t mean we can’t get plenty of snow. Let’s get ready to ski!
Note: This page will be updated frequently throughout the ski season to alert you of approaching storm systems and powder. Be sure to also check the Conditions Report for info on ski area operations.
Ski and Snowboard Safety
Those skiing in steep and ungroomed terrain should be familiar with Deep Snow Safety and become informed on traveling and recreating in avalanche terrain. Find more tips on skiing and snowboarding safety here. Avalanche forecasts are available through the Northwest Avalanche Center (Mt. Hood), Central Oregon Avalanche Center, and Wallowa Avalanche Center in Eastern Oregon.
Skiers and snowboarders should always follow the Skier’s Responsibility Code, which exists to raise awareness that there are elements of risk in snow sports that common sense and personal awareness can help reduce:
- Always stay in control. You must be able to stop or avoid people or objects.
- People ahead or downhill of you have the right-of-way. You must avoid them.
- Stop only where you are visible from above and do not restrict traffic.
- Look uphill and avoid others before starting downhill or entering a trail.
- You must prevent runaway equipment.
- Read and obey all signs, warnings, and hazard markings.
- Keep off closed trails and out of closed areas.
- You must know how and be able to load, ride and unload lifts safely. If you need assistance, ask the lift attendant.
- Do not use lifts or terrain when impaired by alcohol or drugs.
- If you are involved in a collision or incident, share your contact information with each other and a ski area employee.